
Figure 8. Changes of cytokine expression in CD163-overexpressing THP-1 macrophages challenged with a double LPS stimulation.
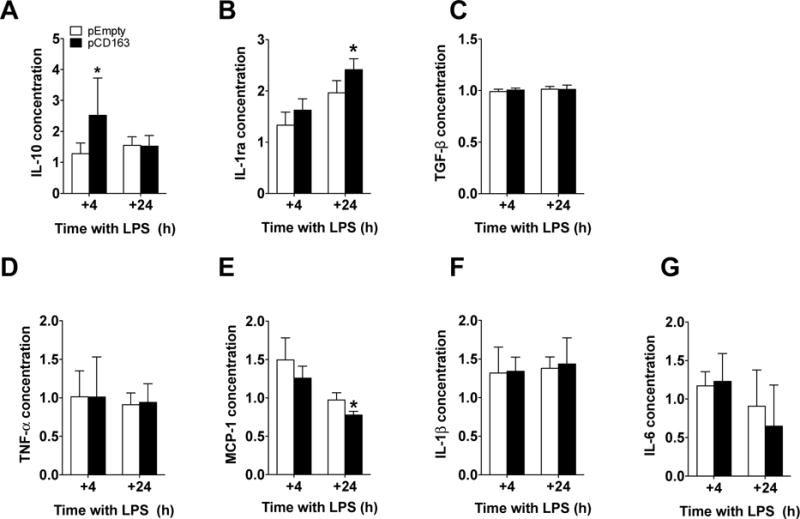
Quantification for IL-10 (A), IL-1ra (B), TGF-β (C), TNF-α (D), MCP-1 (E), IL-1β (F) and IL-6 (G) protein concentration in THP-1 macrophages with a double LPS stimulation and transfected with either a plasmid encoding for CD163 gene (pCD163) or the empty vector (pEmpty) at 4 and 24 hours after the second stimulus (+4 and +24 respectively). The concentration of each molecule was normalized to the control group (Man-PEI), which was assigned a value equal to 1. N = 5–13 per group. *p<0.05, vs. pEmpty by student’s t-test.