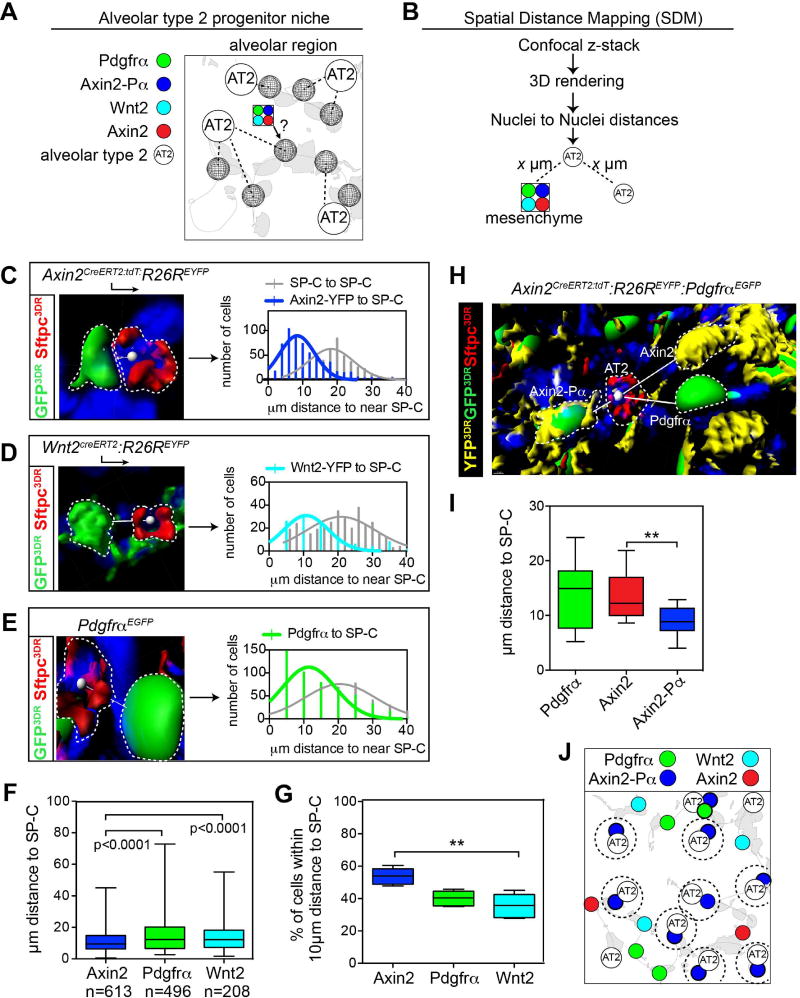
Figure 3. Spatial distance mapping to define the alveolar niche in the lung.
(A) Schematic showing the alveolar niche, consisting of AT2 cells near mesenchymal cells. (B) Flow-chart for spatial distance mapping. (C–E) Representative images showing mesenchymal cell nuclei to nearest AT2 nuclei vectors from the indicated mice. Distance vectors were plotted in frequency distribution plots that show the frequency of distance relationships within 2µm bin sizes along the x-axis. (F) Average distance between each mesenchymal lineage and an AT2 cell. (G) Percent of each mesenchymal lineage population found within 10µm of an AT2 cell. (H) Reconstructed z-stack from Axin2CreERT2:tdT:R26REYFP:PdgfrαEGFP lungs indicating distances between AT2 cells (Sftpc+) and Axin2, Axin2-Pα and Pdgfrα cell lineages. (I) Average distance between each mesenchymal lineage and an AT2 cell indicates that the Axin2-Pα cell resides closest in proximity to AT2 cells. (J) Schematic showing Axin2-Pα cells are spatially distributed near Sftpc+ AT2 cells. Box and whisker plots, bars are min and max values. Asterisks * or ** indicates p<0.05, 0.01 respectively by one-way ANOVA.

