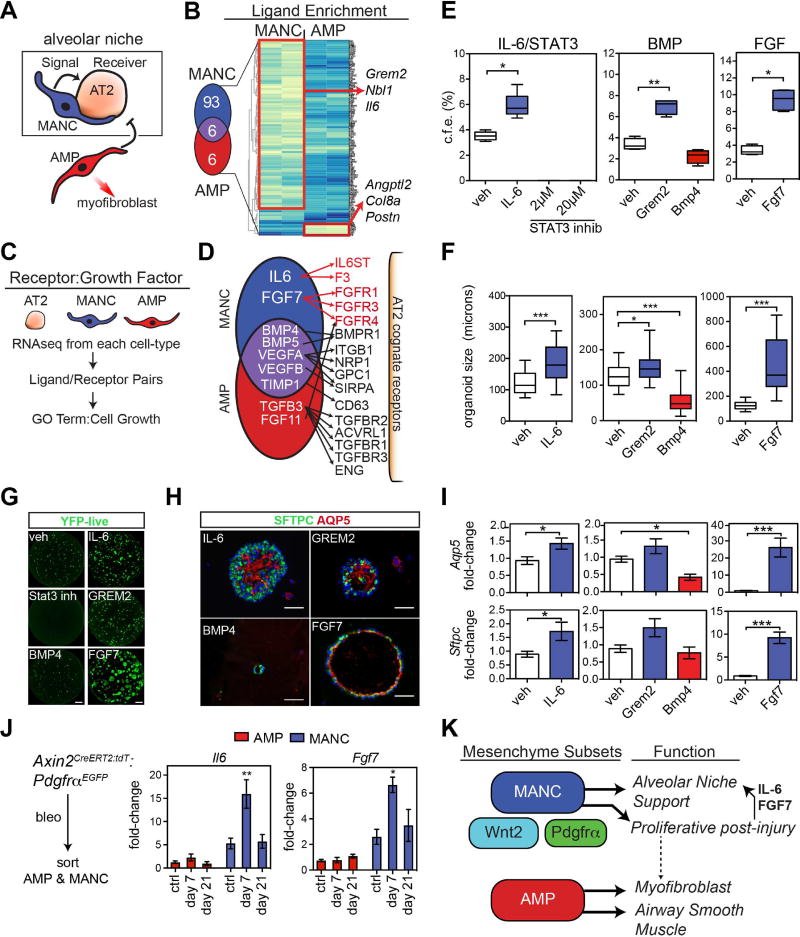
Figure 7. Defining the lung alveolar niche through characterization of the MANC–specific AT2 receptome.
(A) MANC cells are intimately associated with AT2 cells produce signals that likely direct AT2 growth or quiescence. (B) MANC and AMP enriched genes for secreted proteins were identified from the popRNA-seq data. The Venn diagram shows the number of unique genes and the genes listed to the right are unique to either the MANC or AMP lineage as indicated. (C) Schematic for cell type ligand/receptome analysis (D) Summary of acquired data as outlined in C, showing IL6:IL-6ST and Fgf7:Fgfr identified as unique ligand:receptor pairs in the MANC:AT2 interactions. (E) SftpcCreERT2:R26REYFP cells were combined with MANC as outlined in Figure 4 and colony forming efficiency was calculated after 21 days in culture. (F) In the same experiments, organoid size was calculated, error bars are min and max values. (G) Native EYFP fluorescence of representative wells from the control (veh) and treated AT2 cells cultured with MANCs, scale bar is 1 mm (H) Immunostaining of the organoids from the indicted treatment groups for expression of Sftpc and Aqp5, scale bar is 50µm (I) Q-PCR from the indicated conditions showing differential expression of AT1 differentiation marker Aqp5 (top row) and the AT2 cell marker Sftpc (bottom row). (J) Assessment of the in vivo relevance of MANC produced growth factors Il6 and Fgf7, showing changes due to bleomycin injury. (K) Overview model showing that regionally distributed mesenchymal lineages are distinct with MANCs spatially located next to AT2 cells to promote AT2 cell growth and differentiation while a distinct AMP lineage is poised to generate myofibroblasts following tissue damage. N=4–5 mice per condition, the same veh conditions were used for Bmp and Fgf experiments and are re-plotted for each pathway graph to aid visualization. Error bars are means ± SEM. *, **, ** are p<0.05, 0.01 and 0.001 respectively by U-test or one-way ANOVA. Scale bars=25µm.

