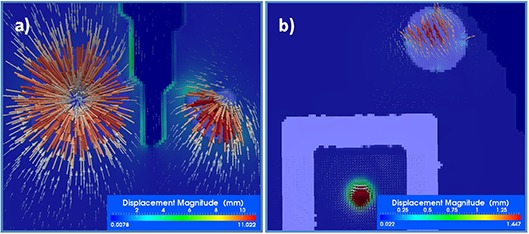
Figure 3. Details of different inserts in the phantom experiment, comparing the displacement field, shown as scaled vectors, with the vortex map, shown as a color‐coded overlay in the background. The vortex map correctly identifies sudden changes in the displacement field.

