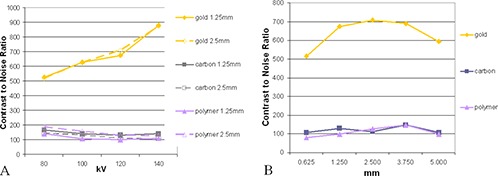
Figure 2. CT contrast‐to‐noise‐ratio (a) with varying kV, 1.25 mm (solid lines) and 2.5 mm (dashed lines) slice thicknesses; gold, carbon, and polymer markers are represented by diamonds, squares, and triangles, respectively. CT contrast‐to‐noise‐ratio (b) with varying slice thickness for gold, carbon, and polymer fiducial markers. Voltage was held at 120 kV.

