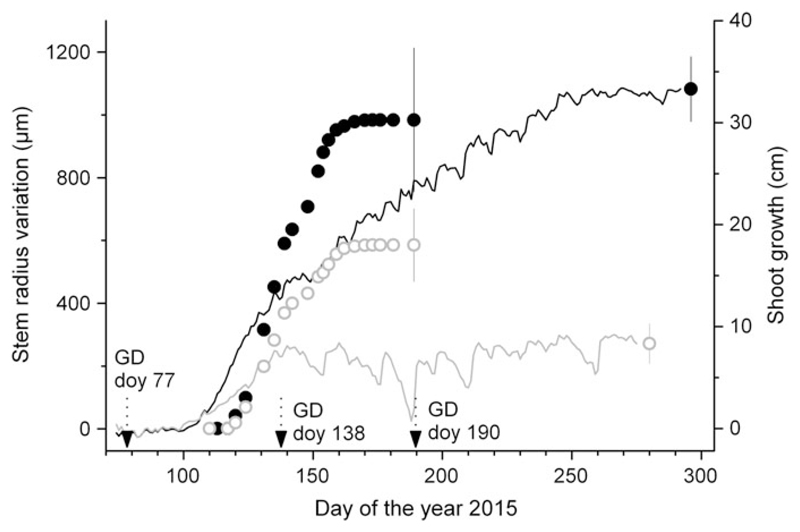
Figure 2.
Intra-annual dynamics of radial (lines) and shoot growth (symbols) in watered (black line and filled circles) and drought-stressed (gray line and open symbols) non-girdled trees. Bars indicate mean standard deviation among records. Arrows indicate girdling dates (GD; doy = day of the year).

