Figure 3.

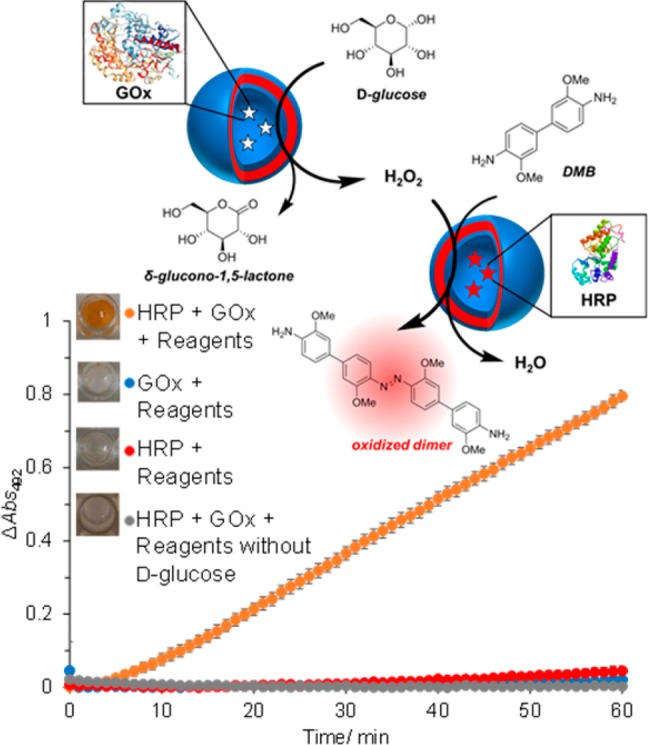
Schematic and activity of the cascade reaction between HRP- and GOx-loaded vesicles with negative controls. Error bars show the standard deviation from four repeats. Insets: End-point photographs of wells after 1.5 h.

Schematic and activity of the cascade reaction between HRP- and GOx-loaded vesicles with negative controls. Error bars show the standard deviation from four repeats. Insets: End-point photographs of wells after 1.5 h.