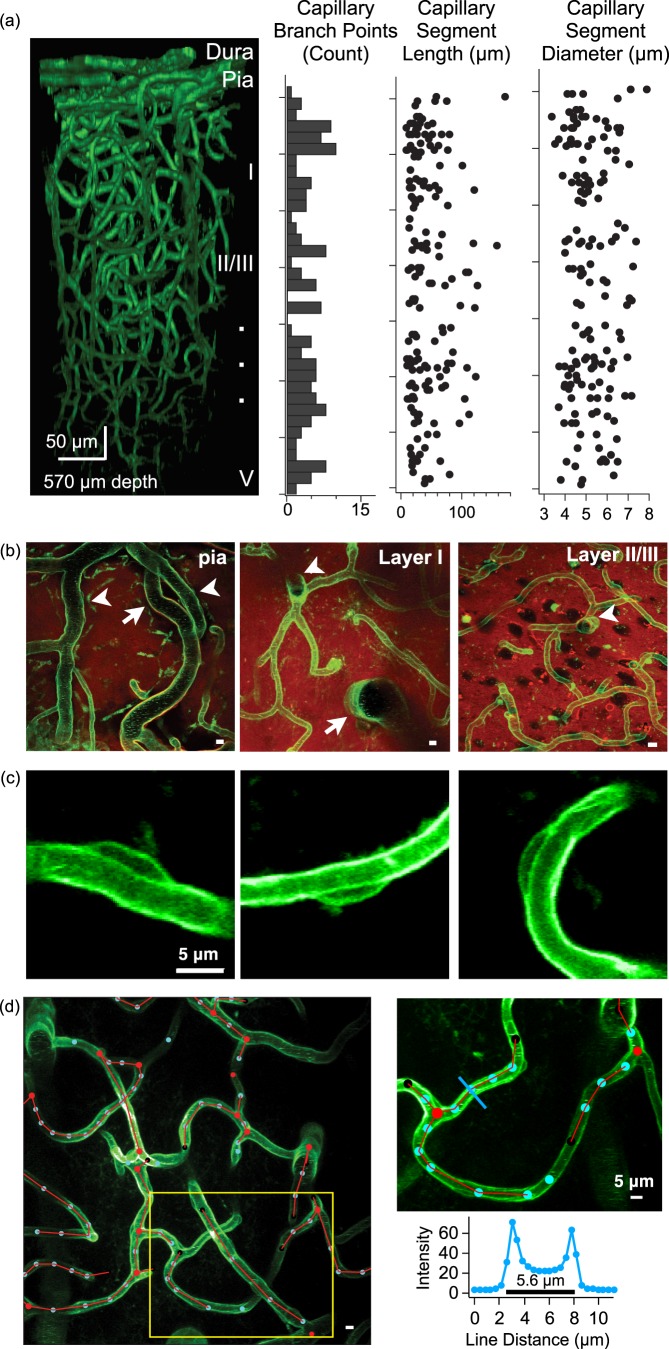
Figure 1.
In vivo imaging of cerebral vasculature. (a) An exemplar 3D reconstruction of motor cortex vasculature imaged in an adult Tie2-Cre:mTmG mouse (left). Plots illustrate the number of capillary branch points (histogram), capillary segment length, and capillary segment diameter as a function of cortical depth for this same reconstruction. (b) Maximal-intensity projections of imaging planes at the level of the pial surface (left, 12 -µm thick projection), layer I (middle, 30 µm projection), and layer II/III (right, 30 µm projection). The pial surface has large arteries (arrow) and veins (arrow heads), layer I is mostly devoid of neuronal somata while layer II/III has a higher density of neuronal somata (which appear as black holes in the red fluorescence channel). Both layer I and II/III have capillary segments, diving arterioles (arrow) and ascending venules (arrow head). Scale bars are 5 µm. (c) Maximal-intensity projections of three pericyte cell bodies adhering to capillary segments in layer II/III. (d) An exemplar image showing semi-automated 3D tracing of vasculature in layer II/III (left) showing branch points (red circles), way-points (blue circles), and red connecting lines. Image is a maximal z-projection from 200 to 220 µm depth from the pial surface, scale bar is 5 µm. The panel in the upper right shows a detailed view of the capillary segment tracing which corresponds to the yellow box on the left image. The blue line is used to measure capillary diameter at one way point, using the intensity profile (lower right).

