
Figure 4.
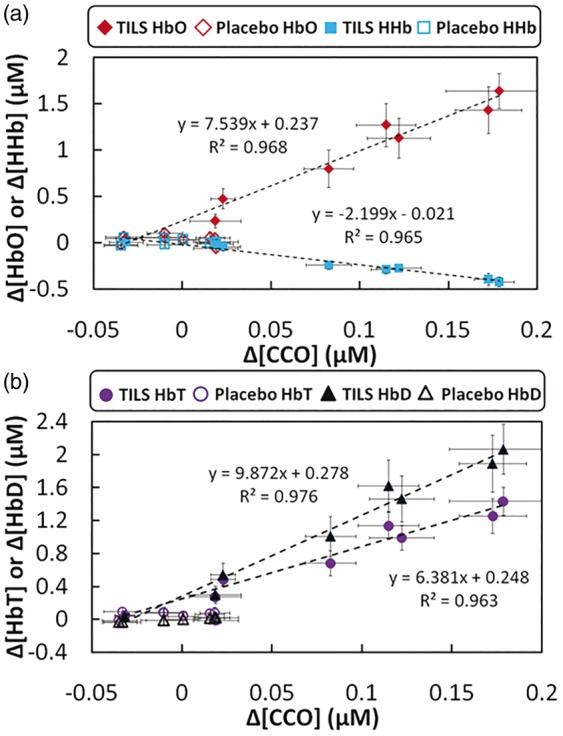
(a) Relationships between subject-averaged Δ[CCO] vs Δ[HbO] and Δ[CCO] vs Δ[HHb] that resulted from TILS and placebo treatment (mean ± SE, N = 11). Solid red diamonds display the relationship of Δ[CCO] vs Δ[HbO]; solid blue dots display the relationship of Δ[CCO] vs Δ[HHb]. Both red open diamonds and blue open squares represent placebo-treated Δ[CCO] vs Δ[HbO] and Δ[CCO] vs Δ[HHb], respectively. (b) Relationships between subject-averaged Δ[CCO] vs Δ[HbT] and Δ[CCO] vs Δ[HbD] caused by TILS and placebo treatment. Solid purple circles display the relationship of Δ[CCO] vs Δ[HbT]; solid black triangles display the relationship of Δ[CCO] vs Δ[HbD]. Both red open circles and open triangles represent placebo-treated Δ[CCO] vs Δ[HbO] and Δ[CCO] vs Δ[HHb], respectively. All error bars represent standard errors of means from respective chromophore concentrations.