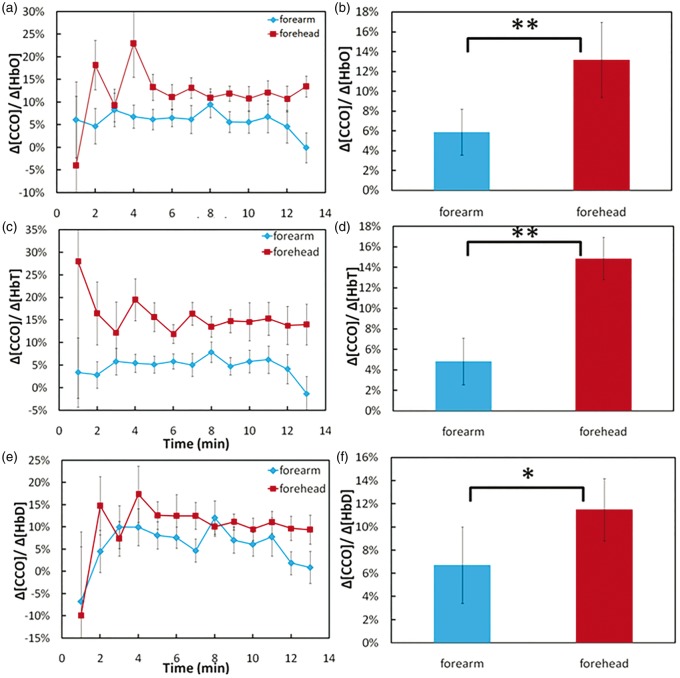
Figure 5.
Ratios of (a) Δ[CCO]/Δ[HbO], (c) Δ[CCO]/Δ[HbT], and (e) Δ[CCO]/Δ[HbD] during and after infrared laser stimulation on the right forehead of 11 human subjects (red symbols) and on the right forearm of another group of 11 human subjects (blue symbols). Time-averaged ratios of (b) Δ[CCO]/Δ[HbO], (d) Δ[CCO]/Δ[HbT], and (f) Δ[CCO]/Δ[HbD] with corresponding standard deviations in both forearm and forehead stimulation cases. “**” marks significant difference (p < 0.01, two sample t-test) of Δ[CCO]/Δ[HbO] or Δ[CCO]/Δ[HbT] between the stimulated cases. “*” marks significant difference (p < 0.05, two sample t-test) of Δ[CCO]/Δ[HbD] between the stimulated cases.

