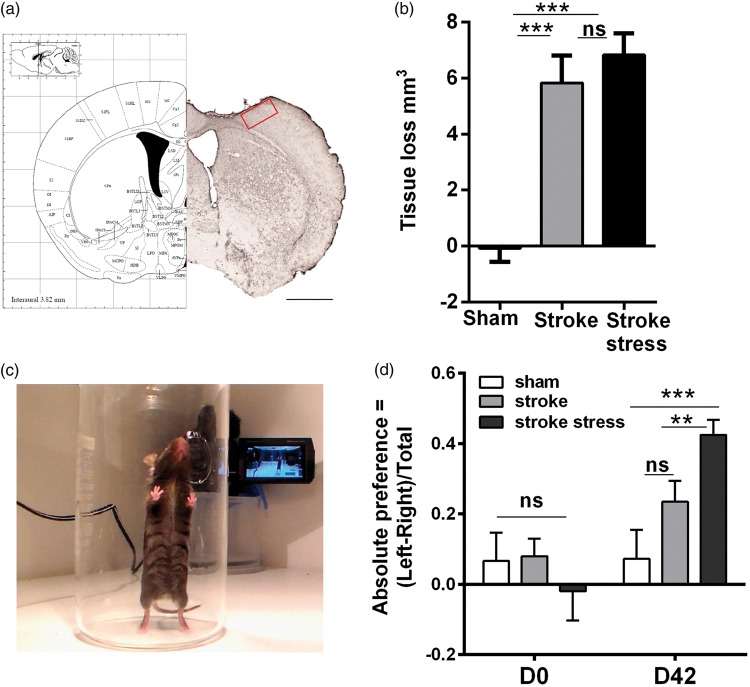
Figure 1.
(a) Schematic representation (left) and representative section (right) of the somatosensory cortex and motor cortex regions at Bregma (0.0 mm). Red square is the peri-infarct zone, which is located in the primary somatosensory cortex forelimb region (S1FL) and was the primary subject of the investigations undertaken in the current study. Scale bar (bottom right panel a) represents 1 mm. The picture depicted in a (left) has been adapted from Paxinos and Franklin.83 (b) Illustrates the tissue loss of the three groups examined. (c) Illustrates the placement of the mouse in the cylinder in which the spontaneous forelimb placement task is undertaken. (d) Provides the means levels of paw asymmetry prior to and 6 weeks following infarction. Data expressed as mean ± SEM for sham = 8, stroke = 10 and stroke stress = 12. ns: not significant, **p < 0.025, ***p < 0.016, Holm’s a priori analysis α correction procedure.

