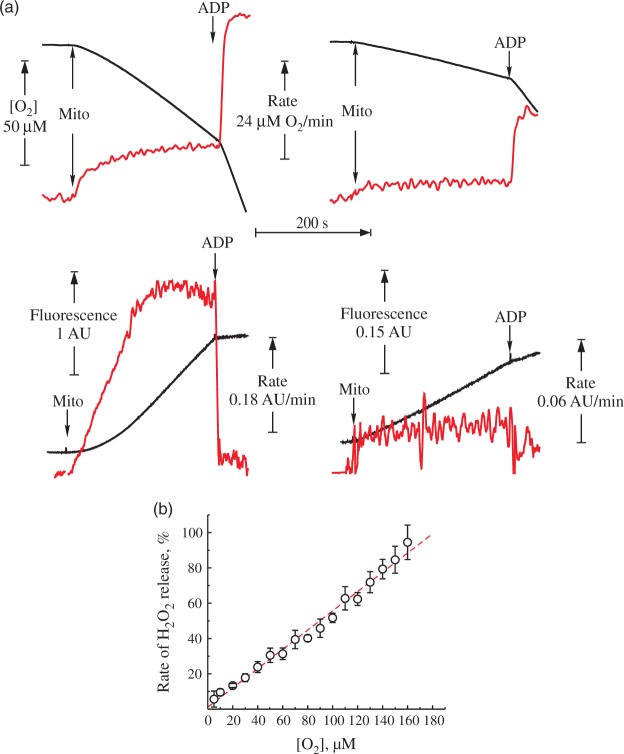
Figure 1.
H2O2 release during the forward and reverse electron transfer. Representative traces of respiration (top) and generation of H2O2 (bottom) by intact mitochondria from mouse brain. (a) The reaction was started by addition of mitochondria 0.16 mg of protein/ml to the medium composed of 125 mM KCl, 0.2 mM EGTA, 20 mM HEPES-Tris (pH 7.4), 4 mM KH2PO4, 2 mM MgCl2, 2 mg/ml BSA, 10 μM Amplex UltraRed and 4 U/ml horseradish peroxidase at 37℃. Substrates were either 5 mM pyruvate and 2 mM malate (right) or 5 mM succinate and 1 mM glutamate (left). Black traces correspond to oxygen concentration (top) and Amplex UltraRed fluorescence (bottom). The rate of the change of these signals per minute is shown in red. (b) Release of H2O2 during coupled oxidation of 5 mM succinate and 1 mM glutamate as a function of oxygen concentration. 100% rate corresponds to 1400 pmol H2O2 × min−1 × mg protein−1. Oxygen concentration as measuring directly by the Oroboros respirometer was rapidly varied by continuously purging the headspace with nitrogen as described in Materials and Methods section.

