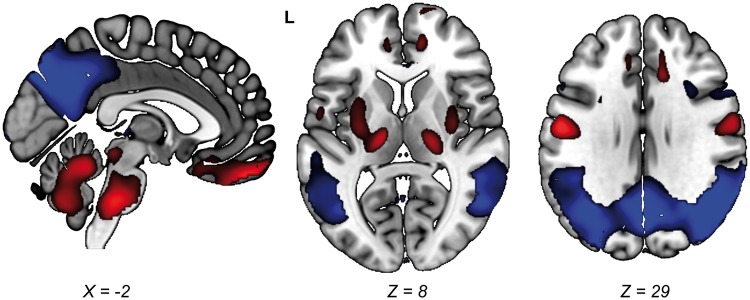
Figure 1.
Topography of the ADRP. The ADRP was identified in 18F-FDG-PET data (anatomically registered to an 18F-FDG-PET template) as described previously.11 Stable voxels in the ADRP were overlaid onto a T1 MRI template to show the most salient regions in the pattern. Stable voxels in the ADRP were determined with bootstrap resampling.12 In this procedure, the pattern identification process (SSM/PCA) is repeated multiple times on randomly sampled data with replacement. This yields multiple slightly different patterns and thus a distribution of weights per voxel. Using this distribution, confidence intervals (CIs) per voxel can be determined. Voxels with CIs straddling zero can be interpreted as non-informative and are therefore excluded from the visualization. Here, we performed 1000 repetitions and applied a one-sided CI threshold of 90% (percentile method). For a discussion of pattern topography, we refer to a previous publication.11 L = Left. Relatively hypermetabolic areas are color-coded red, and relatively hypometabolic areas are color-coded blue. ADRP: Alzheimer’s disease-related metabolic brain pattern.

