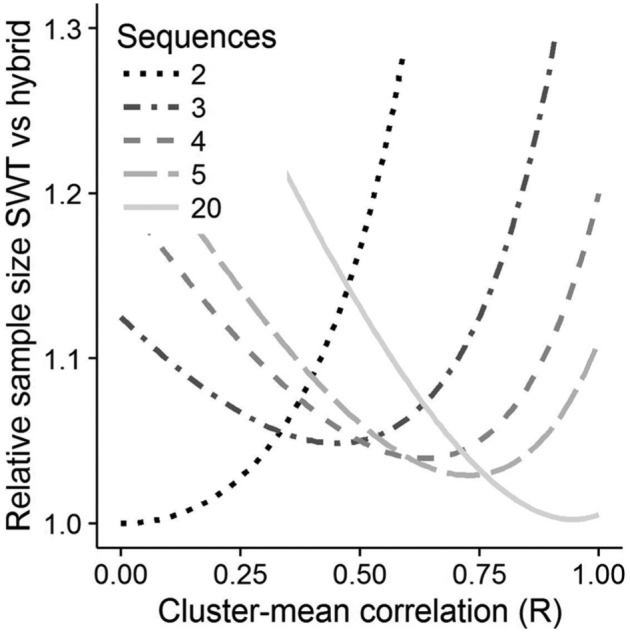
Figure 3.

Graph of the sample size of the SWT with no observations outside rollout, relative to the optimised hybrid against the cluster-mean correlation. Darkest and dotted line = 2 sequences, lightest and solid line = 20 sequences. The optimal SWT is the lowest line at any given cluster-mean correlation.
