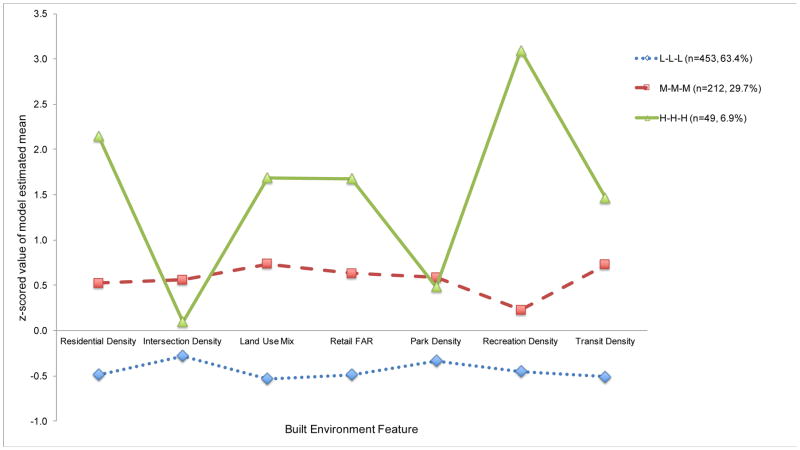
Figure 1.
Patterns of latent profile analysis-estimated indicators means from 3-profile solution for older adults sampled from the Seattle-King County, WA and Baltimore, MD-Washington, DC regions 2005–2008. A z-score of +1.0 reflects an estimated mean that is 1 SD above the observed sample mean for that indicator. L-L-L = low walkability, low transit access, and low recreation access; M-M-M, medium levels of walkability, transit access, and recreation access; H-H-H, high levels of walkability, transit access, and recreation access.

