Figure 2.

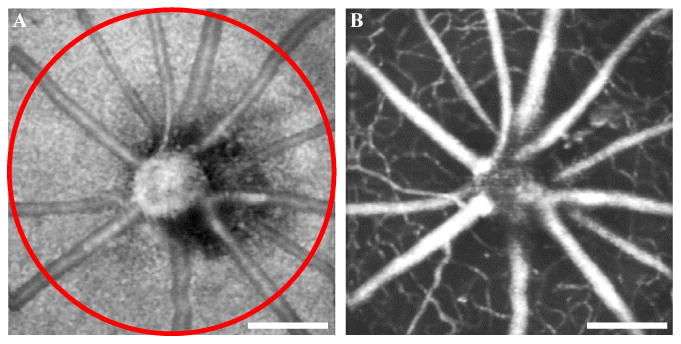
Enface OCT (A) and OCT angiography (B) image of a mouse retina across the optic nerve head (ONH). The red circle shows the scanning area (radius = 1 mm) for the experiment shown in Figure 3. Scale bars indicate 500 μm.

Enface OCT (A) and OCT angiography (B) image of a mouse retina across the optic nerve head (ONH). The red circle shows the scanning area (radius = 1 mm) for the experiment shown in Figure 3. Scale bars indicate 500 μm.