Figure 4.

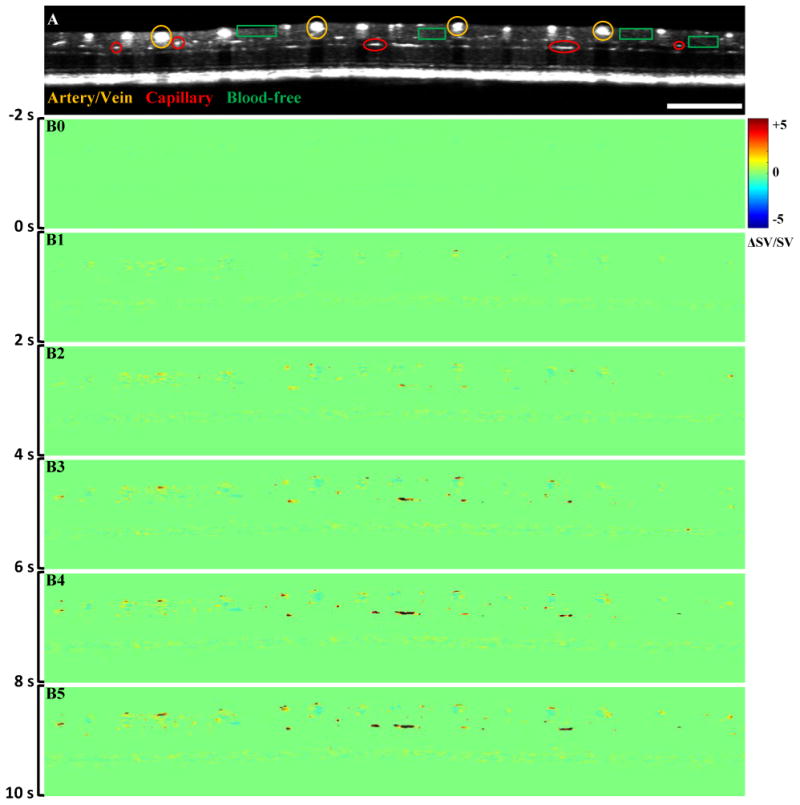
Representative in vivo OCT recording of stimulus evoked hemodynamics. (A) B-scan OCT image; (B) Hemodynamic images at different times. Scale bar indicates 1 mm.

Representative in vivo OCT recording of stimulus evoked hemodynamics. (A) B-scan OCT image; (B) Hemodynamic images at different times. Scale bar indicates 1 mm.