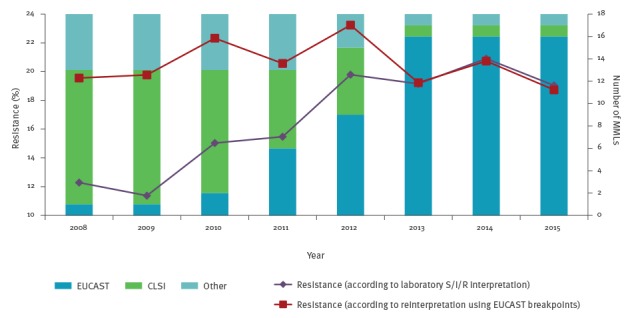
Figure 3.
Time trends for norfloxacin resistance in Escherichia coli, according to laboratory S/I/R interpretation versus re-interpretation of raw testing values according to EUCAST (n = 21,382 samples) and usage of antimicrobial susceptibility testing standards (n = 18 laboratories), the Netherlands, 2008–2015
CLSI: Clinical and Laboratory Standards Institute; EUCAST: European Committee on Antimicrobial Susceptibility Testing; MMLs: medical microbiology laboratories; S/I/R: susceptible/intermediate/resistant.
The analysis includes 18 MMLs for which continuous data over the period from 2008 to 2015 was available. S and R susceptibility breakpoints are, respectively, ≤ 4 and ≥ 16 according to CLSI [14] and ≤ 0.5 and > 1 according to EUCAST [13].

