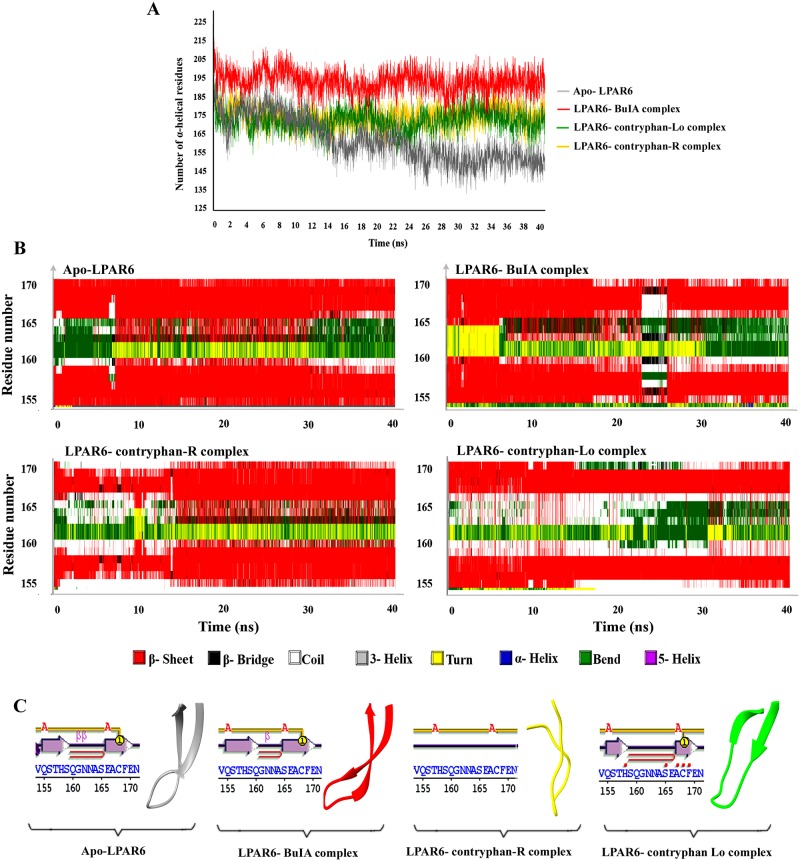
Fig 5. DSSP analysis of simulation trajectories.
(A) Time-dependent analysis of MD trajectories to infer the number of alpha helical residues during simulation time period. Apo and bound forms of LPAR6 with BuIA, contryphan-R and contryphan-Lo are represented in grey, red, golden rod and green colours, respectively. (B) Conformational readjustments in the β-sheet region spanning 155–170 residues during MD simulation runs. Time-dependent plots for of apo-LPAR6 and LPAR6-conotoxin complexes. (C) β- sheet regions in apo-LPAR6 and BuIA, contryphan-Lo and contryphan-R bound states of LPAR6 at 5 ns time scale are shown in grey, red, goldenrod and green ribbons for individual complexes.

