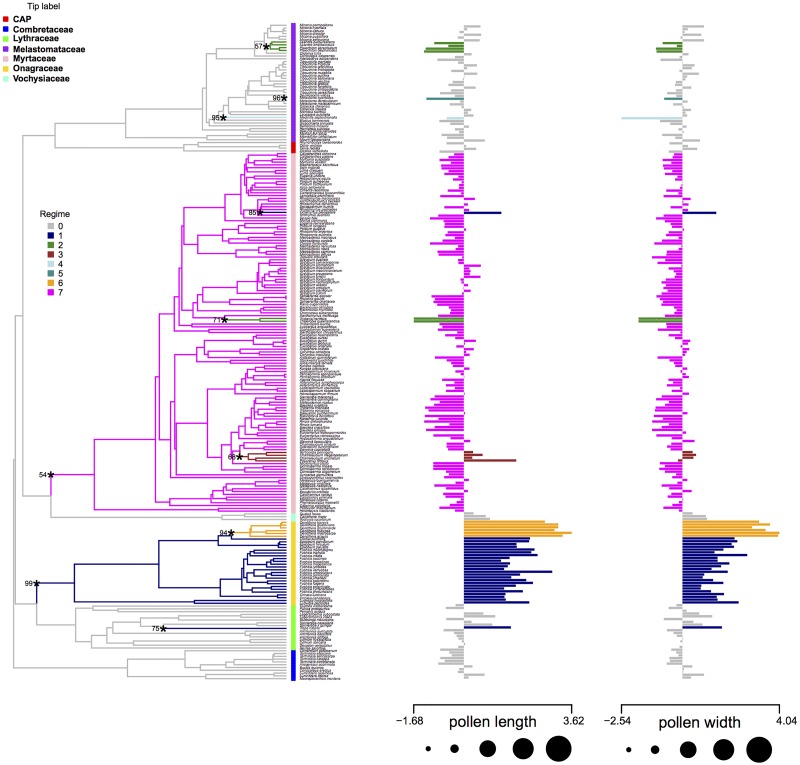
Fig 7. Shifts in size during the evolutionary history of Myrtales on topology.
Shifts of size during the evolutionary history of Myrtales on topology A. The color of the edges of the tree and the bars of the bar plot indicate the regime number of that clade. Asterisks highlight edges where shifts occurred and numbers at their side indicate bootstrap support for the corresponding shift.

