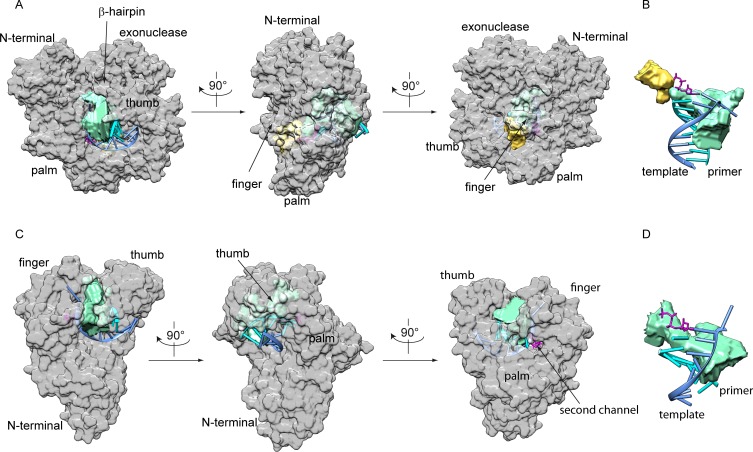
Fig 6. The channel volumes for KOD and KlenTaq DNA pols.
The channel volumes were calculated with 3V algorithm for KOD (A and B) and KlenTaq (C and D) DNA pols, respectively. The protein is shown as grey surface, the primer in cyan and the template in blue. The bound dNTP is shown in magenta. A and C show the location within the enzyme, B and D the channels with respect to the DNA and triphosphate.

