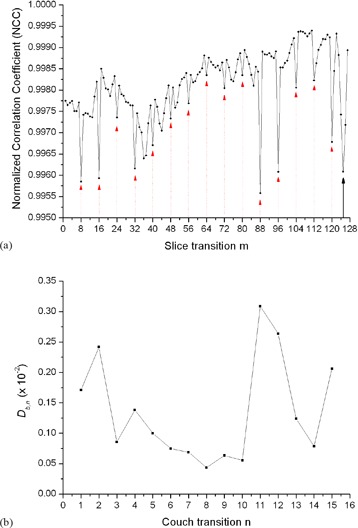
Figure 2. An example (50% phase bin for patient 10) of the NCC between all adjacent slices m and for a scan with 16 couch positions, where . The the decrease of the NCC at each couch transition (indicated by the dot arrow lines). Plot (b) of versus couch transition n for this scan.

