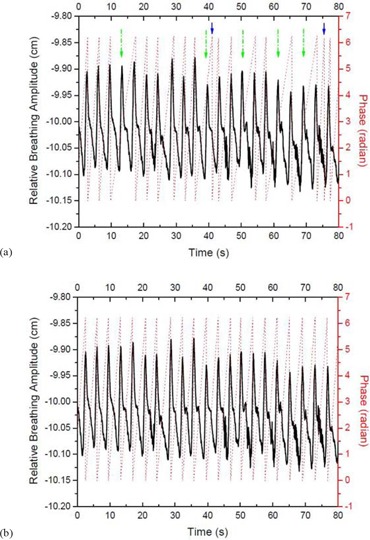
Figure 3. Recorded breathing traces (a) by the RPM software (solid thick curves) with the originally calculated phase values (dotted lines). Five missed peaks and two improperly detected peaks of inhalation are indicated by the long dash‐dot arrows and the short solid arrows, respectively. Recorded breathing traces (b) with recalculated phase values after manually correcting the missed and improperly detected peaks of inhalation.

