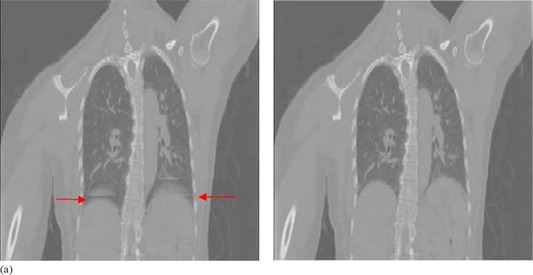
Figure 4. Coronal cross‐sections of the image set of the 50% phase bin for patient 10, sorted using the originally miscalculated phase values (a), and the recalculated phase values (b). Artifacts expressed as overlapping structure in the diaphragm region are indicated by the arrows.

