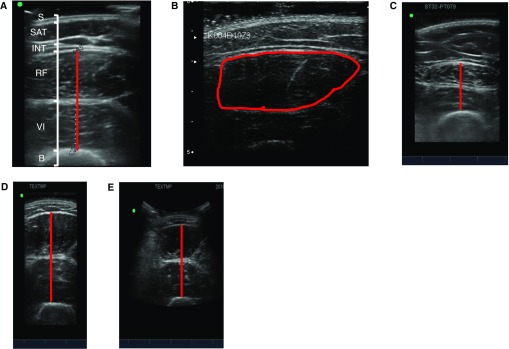
Figure 3.
Illustrations of diverse patient and scan characteristics obtained by ultrasonography. (A) Anatomical labels are identified in a scan depicting muscle layer thickness of a 23-year old non–intensive care unit female with a body mass index of 22.8 kg/m2. Muscle layer thickness would include rectus femoris and vastus intermedius depicted in red. (B) Example of cross-sectional area of a rectus femoris muscle highlighted in red. (C) Muscle layer thickness is shown for a non–intensive care unit individual who has a body mass index of 28.9 kg/m2 and body fat percentage of 45.6% (measured using dual-energy X-ray absorptiometry). The red line depicts muscle layer thickness. (D) Muscle layer thickness is imaged using a linear probe and depicted in red. (E) Muscle layer thickness is imaged using a curvilinear probe, depicted in red, in the same individual as in (D). B = bone; INT = interface between subcutaneous adipose tissue and rectus femoris; RF = rectus femoris; S = skin; SAT = subcutaneous adipose tissue; VI = vastus intermedius.

