Figure 6.

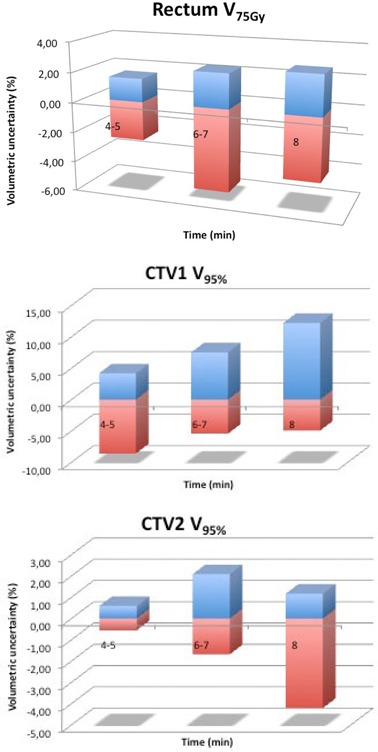
Relative uncertainty of rectum (a), and for of CTV1 (b) and CTV2 (c). The positive values represent the mean overdosage and the negative values, the mean underdosage.

Relative uncertainty of rectum (a), and for of CTV1 (b) and CTV2 (c). The positive values represent the mean overdosage and the negative values, the mean underdosage.