
Figure 2.
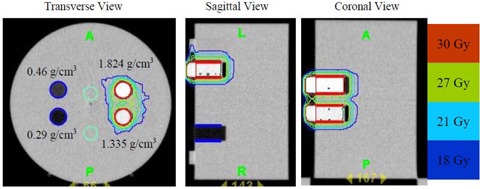
Transverse, sagittal and coronal views of the MVCT scan of the “cheese” phantom with two high‐density inserts ( and ) and two low‐density inserts ( and ). The two high‐density inserts are delineated in red as the PTV (prescribed to 30 Gy). The two low‐density inserts are delineated in blue as avoidance structures. Isdodose curves (100%, 90%, 70% and 60%) are also shown.