Figure 5.

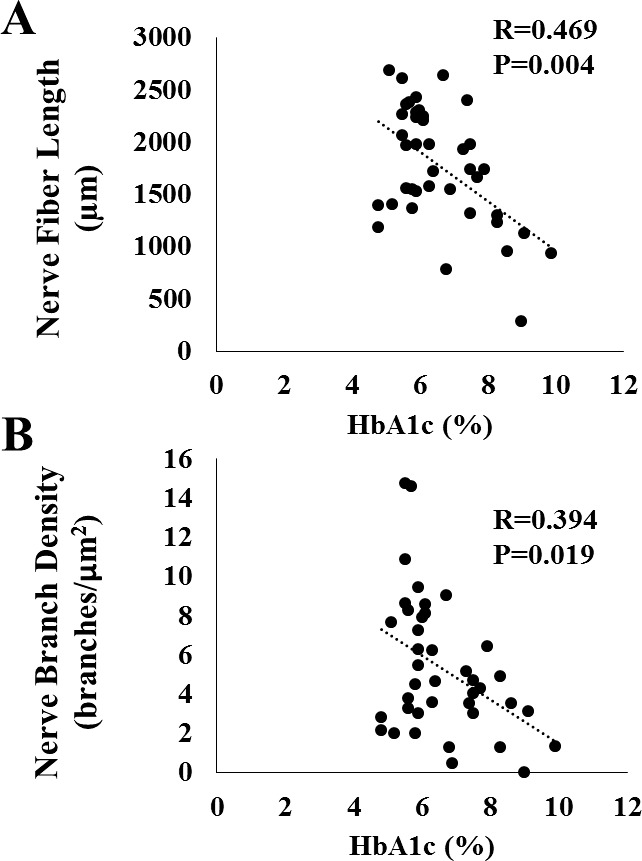
The relationship between nerve fiber morphology and HbA1c. (A) Regression analysis showed a moderate correlation between nerve fiber length and HbA1c (R = 0.469, P = 0.004). (B) The was a weak correlation between nerve branch density and HbA1c (R = 0.394, P = 0.019).
