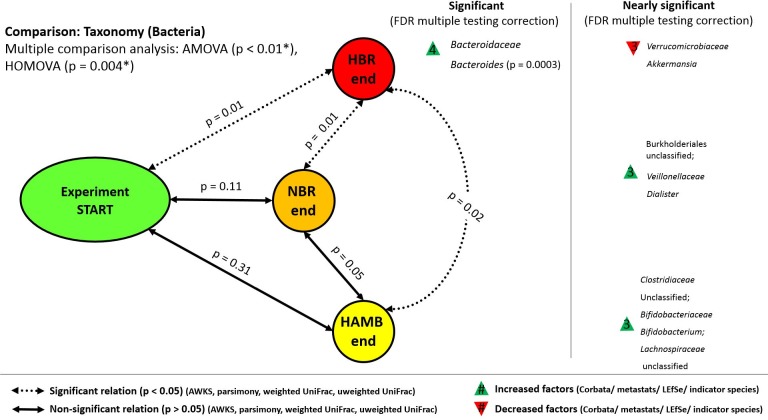
Fig 2. Schematic overview of the detected changes in microbial communities.
The congruency of four statistical tests was used to detect significant differences in the structure of microbial community. The additional four statistical tests were used to congruently identify the first responding taxa over the course of the PlanHab experiment. The end-points of the PlanHab experiment with the significant changes are shown (p<0.05, FDR corrected). NBR–normoxic bed rest, HBR–hypoxic bed rest, HAmb–hypoxic ambulatory.

