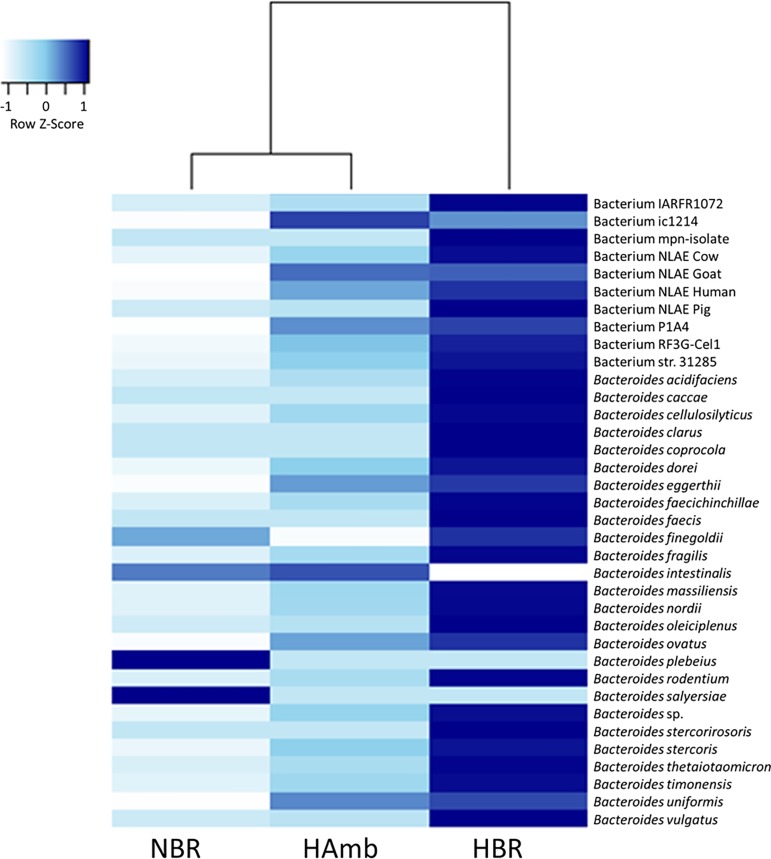
Fig 3. Heatmap plot of the genus Bacteroides sequences.
NBR, HBR and HAmb sequences were classified at species level and their number normalized to their mean at week four (the end of PlanHab study). The specific and significant increase in the levels of various Bacteroides species in HBR can be seen (p<0.05).

