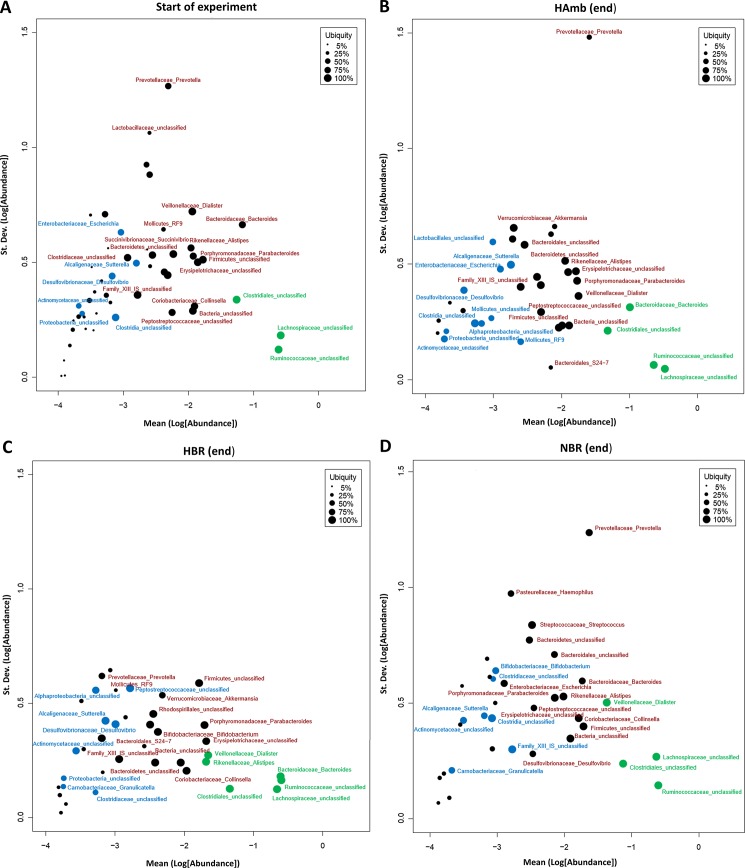
Fig 4. The overview of core microbiomes at the start-up and endpoint of the PlanHab experiment.
The Corbata plots of abundance (x-axis), variability (y-axis) and ubiquity (circles). Each circle represents a single taxon with its size proportional to the ubiquity of the taxon, thus the larger the circle, the more ubiquitous the taxon across the cohort. Taxa were classified and divided into major (green) and minor (blue) core microbiomes next to other bacterial taxa unclassified as either major or minor core (black). Taxa towards the top of the plot have greater variation. Abundance increases towards the right of the plot. (A) Microbiomes at start-up of PlanHab experiment; (B) hypoxic ambulatory (HAmb); (C) hypoxic bed rest (HBR); and (D) normoxic bed rest (NBR).

