
Figure 4.
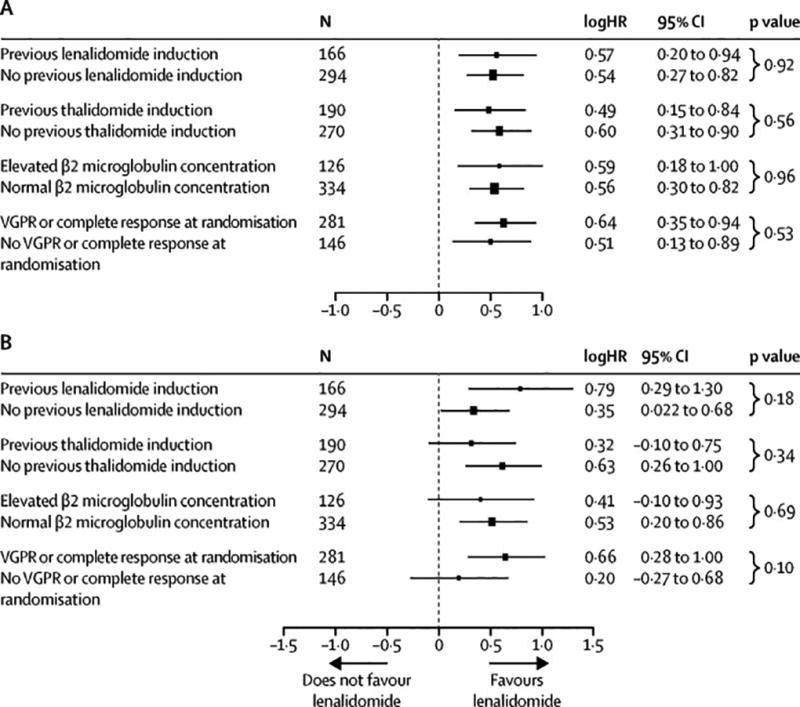
Forest plot of time to progression (A) and overall survival (B). Hazard ratios from subgroup analyses are shown on a natural-log scale. The radii of the circles are proportional to the inverse of the square of the standard error.
Official websites use .gov
A
.gov website belongs to an official
government organization in the United States.
Secure .gov websites use HTTPS
A lock (
) or https:// means you've safely
connected to the .gov website. Share sensitive
information only on official, secure websites.
Forest plot of time to progression (A) and overall survival (B). Hazard ratios from subgroup analyses are shown on a natural-log scale. The radii of the circles are proportional to the inverse of the square of the standard error.