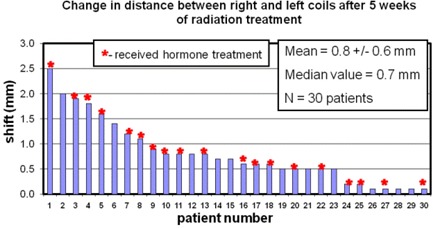
Figure 3.

The stability of the coils over five weeks of radiation therapy. For each patient, the relative change in distance between the two coils is plotted. The patient numbers were chosen in order of decreasing observed shift. The patient numbers are consistent in all the figures. An asterisk at the top of a bar indicates that this patient received hormone treatment. The mean shift across all patients is shown in the insert.
