Figure 5.

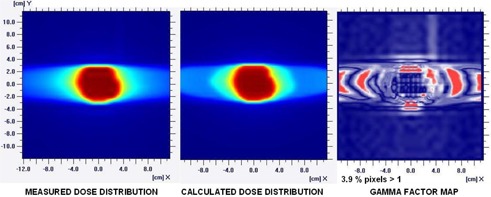
Measured and calculated dose distribution profiles of the frontal isocenter plane with gamma analysis (3 mm and 3%) for the brain tumor DAT plan.

Measured and calculated dose distribution profiles of the frontal isocenter plane with gamma analysis (3 mm and 3%) for the brain tumor DAT plan.