Figure 13.

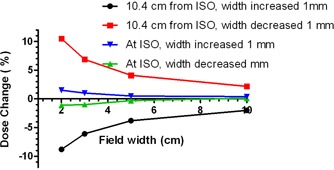
Percent change in calculated dose with the arc width change of 1 mm on each side. Isocenter dose (representative of Delat 4 ) compared with the ArcCHECK detector location (10.4 cm from isocenter).

Percent change in calculated dose with the arc width change of 1 mm on each side. Isocenter dose (representative of Delat 4 ) compared with the ArcCHECK detector location (10.4 cm from isocenter).