
Figure 4.
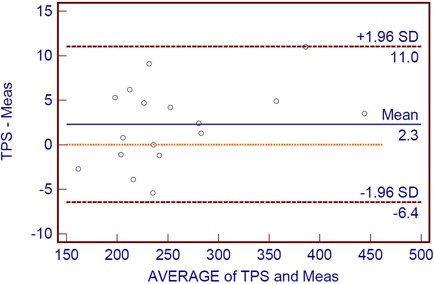
Bland‐Altman plot for the calculated absolute doses and measured doses. The outer lines indicate the 95% limits of agreement , and the center line shows the average difference (2.3). Below the center line, the dotted line indicates zero difference between the two doses.