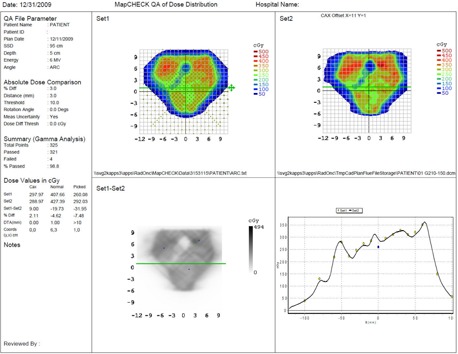
Figure 5.

Dose profile of a pelvis measured via MapCHECK using the partial arc method. The upper left represents the measured dose, and the upper panel shows the fluence through Eclispe TPS. The lower left panel compares the profiles, and assesses the gamma criterion (less than 3% difference between the measured and calculated doses, and less than 3 mm distance to agreement).
