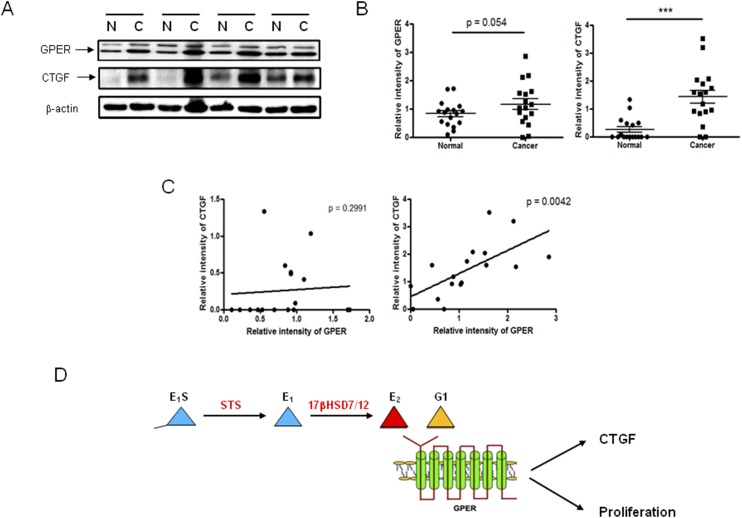
Figure 5.
CTGF and GPER expression correlates in human CRC. (A) Immunoblotting of GPER and CTGF expression in normal (N) and cancerous (C) human colon tissue. β-Actin was used as a loading control. One representative blot from three independent experiments. (B) GPER and CTGF expression were increased in human CRC, as measured by the immunoblotting relative intensity to β-actin. *P < 0.05, ***P < 0.001 (two-tailed Student t test used; n = 17). (C) Correlation between GPER and CTGF relative intensity in normal and cancerous human colon tissue (n = 17). (D) Schematic diagram showing proposed pathway through which estrogens act, via GPER, to augment proliferation in CRC.

