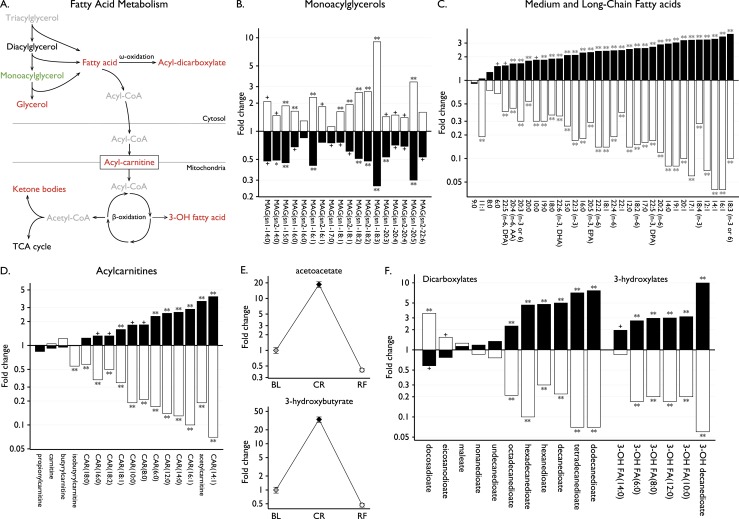
Figure 3.
Fatty acid oxidation and lipolysis. (A) Metabolites involved in lipolysis and fatty acid oxidation that significantly increased (red) or decreased (green) with CR. Some metabolites were not measured in this assay (gray). (B–D) Fold changes in (B) monoacylglycerols (MAG), (C) medium and long-chain fatty acids, and (D) acylcarnitines (CAR) with CR (black) and RF (white). Lipid species are annotated using the following convention: lipid class [number of carbon atoms]:[number of double bonds], [position of double bond(s) if known]. In addition, for MAG, sn1 or sn2 indicate the esterification position in the glycerol backbone, which links the acyl group. Some fatty acids are also designated by abbreviations, such as arachidonic acid (AA), docosahexaenoate (DHA), docosapentaenoate (DPA), and eicosapentaenoate (EPA). (E) Fold changes in ketone bodies between baseline (BL), CR, and RF; mean ± SEM. (F) Fold changes with CR (black) and RF (white) in other lipid species involved in fatty acid oxidation. Statistical significance is presented as follows: + for P values between 0.001 and 0.05; * for P values ≤ 0.001; ** for P values ≤ 0.001 and q values ≤ 0.001.

