
Figure 2. Predicting cell fractions in blood samples.
(A) Predicted vs. measured immune cell proportions in PBMC (dataset 1 (Zimmermann et al., 2016), dataset 2 (Hoek et al., 2015)) and whole blood (dataset 3 (Linsley et al., 2014)); predictions are based on the reference profiles from circulating immune cells. (B) Performance comparison with other methods. Significant correlations are indicated above each bar (*p<0.05; **p<0.01; ***p<0.001). (C) Predicted immune cells' mRNA proportions (i.e., without mRNA renormalization step) vs. measured values in the same datasets. Correlations are based on Pearson correlation; RMSE: root mean squared error. Proportions of cells observed experimentally are given in Supplementary file 3B-D.

Figure 2—figure supplement 1. Comparison of multiple cell fraction prediction methods in blood datasets.

Heatmaps show (A) the Pearson R correlation and (B) the root mean squared error, between the cell fractions predicted by each method and the experimentally measured fractions (dataset 1 [Zimmermann et al., 2016], dataset 2 [Hoek et al., 2015], dataset 3 [Linsley et al., 2014]). Results are based either on all cell types together (noted as ‘All cells’) or for each individual cell type measured experimentally. NA's indicate cases where the cell type could not be predicted by a method. The ‘All cells’ boxes are hatched for TIMER as it does not predict the proportions from all the cell types so that the values computed there correspond to less cell types than for the other methods. For the dataset 2, as there are only two donors data, the results are only presented with all cells together (includes eight data points). In (A) the significance of the Pearson correlation is indicated by stars: *p<0.05, **p<0.01, ***p<0.001, while results with p-values above 0.1 are inside parentheses.
Figure 2—figure supplement 2. Effect of including an mRNA renormalization step for multiple cell fraction prediction methods.

Pearson R correlations are shown as in Figure 2—figure supplement 1A, showing here for each method its original result and the result if the predicted proportions are then renormalized by the mRNA per cell values as is done in EPIC.
Figure 2—figure supplement 3. Effect of the various steps in EPIC on the prediction accuracy.
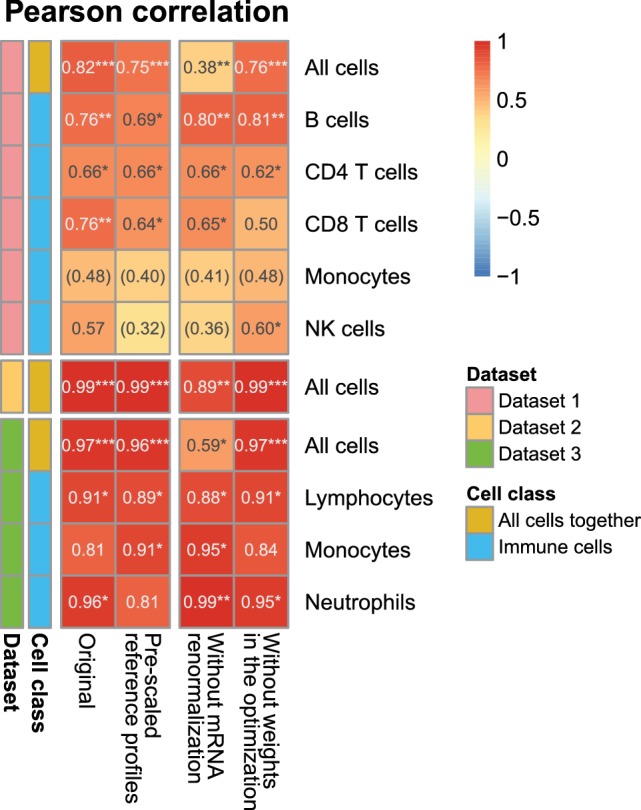
Comparison of the predictions as done in Figure 2—figure supplement 1A, for different variations from EPIC: (1) full EPIC method; (2) EPIC if the gene expression reference profiles are scaled a priori by the mRNA per cell values instead of doing the mRNA normalization step a posteriori; (3) EPIC results without the mRNA normalization step at all; (4) EPIC results when the optimization does not include any weights based on the gene expression variability from the reference profiles.
Figure 2—figure supplement 4. Results with or without known reference profiles for T cells for the cell fraction predictions from various methods.

Results are shown similarly than in Figure 2—figure supplement 1A. Here, we present for various cell fraction prediction methods the results considering all the immune cell types in the gene expression reference profiles followed by the results obtained when removing all references to T cell (and their subsets) from these reference profiles. Only the results of the predictions from the other immune cells than T cells are shown. The effect of removing T cells from MCPcounter and TIMER could not be tested because one cannot select the cell reference profiles or cell types to use in the input of the R codes for these methods.