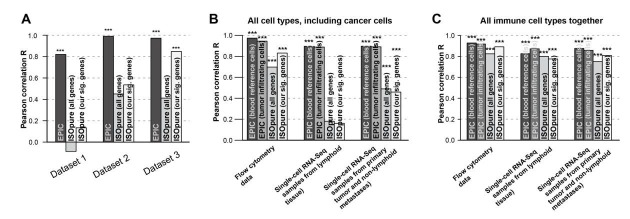
Author response image 3. Comparison of the prediction accuracies for EPIC, ISOpure based on all genes and ISOpure based on the subset of signature genes we derived for EPIC.
(A) For all immune cell types in the blood datasets (dataset 1: Zimmermann et al. 2016; dataset2: Hoek et al. 2015; dataset 3: Linsley et al. 2014). (B) and (C) in the tumor datasets, based on all cell types, including immune, stromal and cancer cells (B), or based only on all the immune cell types (C) (flow cytometry: our new experiment; single-cell RNA-seq: data from Tirosh et al. 2016). The stars above each bar indicate if the Pearson correlation was significant (* p < 0.05; ** p < 0.01; *** p < 0.001). These figures are the same than in our manuscript Figures 2B and 5A-B but comparing different ISOpure results and EPIC ones.

