Figure 5.

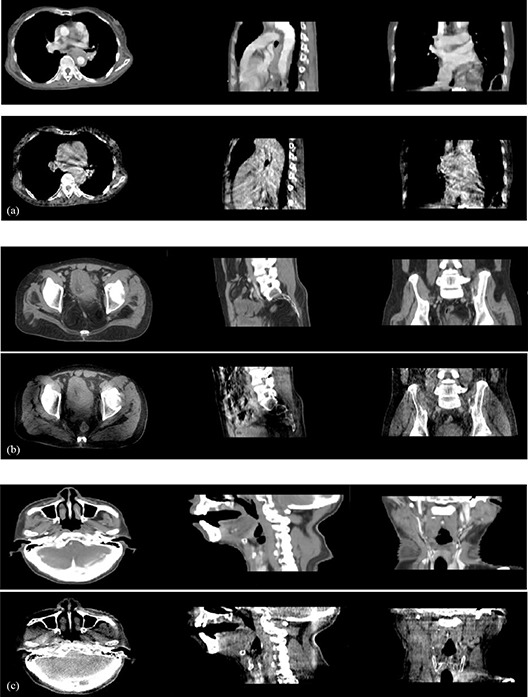
Planning CT and cone‐beam CT image comparisons, where images are 2D slices from 3D dataset: (a) chest images, (b) prostate images, (c) H&N images; in each group, the first row is CT image for planning, the second row is daily CBCT.

Planning CT and cone‐beam CT image comparisons, where images are 2D slices from 3D dataset: (a) chest images, (b) prostate images, (c) H&N images; in each group, the first row is CT image for planning, the second row is daily CBCT.