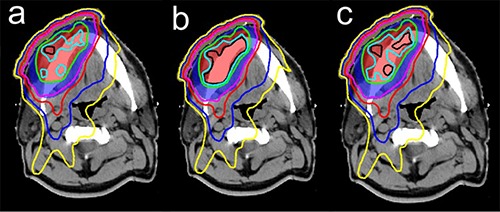
Figure 1.

Dose distributions calculated for patient #1 using CT‐derived density (a), homogeneous density (b), and bulk density (c). The red shaded region is primary PTV and the blue is secondary PTV. Primary PTV was prescribed at 7000 cGy, secondary PTV was prescribed at 5600 cGy. The isodose lines shown are 7490 cGy (black), 7350 cGy (light blue), 7000 cGy (green), 5600 cGy (purple), 4900 cGy (red), 3500 cGy (blue), and 2500 cGy (yellow).
