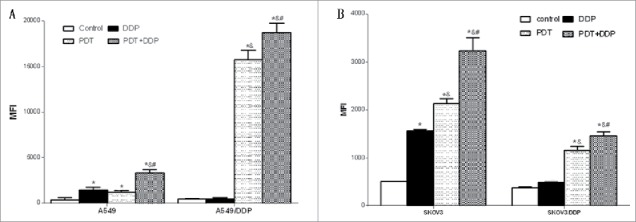
Figure 5.

Intracellular level of ROS in A549 and A549/DDP (A), and SKOV3 and SKOV3/DDP (B) cells. PDT increased the level in 4 cell lines, but DDP increased the level in only A549 and SKOV3 cells; the highest ROS level occurred in group PDT + DDP in 4 cell lines. Data were mean ± standard deviation for 3 independent experiments. *: vs. group Ctrl, p < 0.05; &: vs. group DDP, p < 0.05; #: vs. group PDT, p < 0.05.
