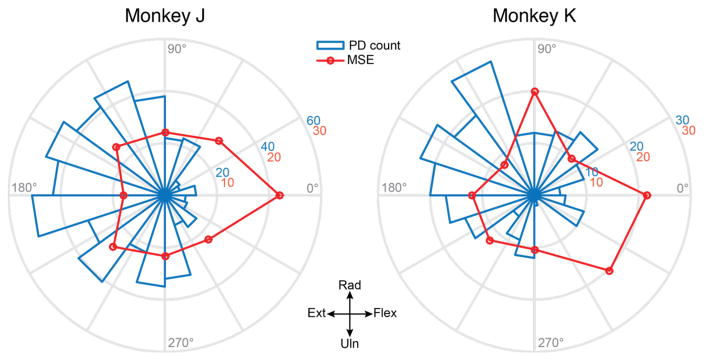
Figure 7.
Non-uniform distribution of the preferred directions of neural recordings and offline force prediction accuracy. Polar histograms (blue) show the total number of neural signals with a PD within each of 20 bins dividing the 2D force space, across all datasets for each monkey. There was a marked paucity of signals with PDs near the 0° (flexion) axis for both monkeys, as well as in the 270–360° quadrant for monkey K. The MSE of the optimal force predictions was higher during the presentation of targets falling in these directions (red curve).

