
Figure 4.
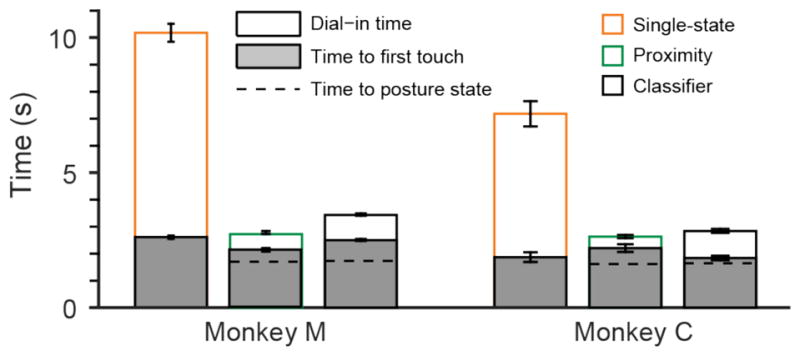
Average time to target acquisition. Filled bars show the average time between go cue and first target touch. Open bars show the mean dial-in time (the time between first target entry and the final (successful) target entry). The total height of the bars shows the time from go cue to target acquisition (without the hold period). Error bars represent the 95% confidence interval of the mean. For the dual-state decoders, dashed lines represent the average time when the classifier output first switched to the posture state in a given trial. Shorter times mean better performance.