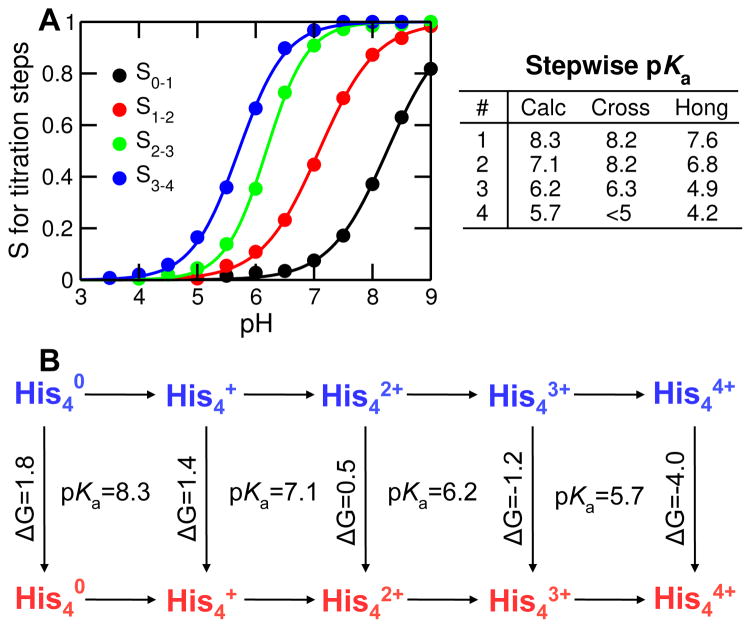
Figure 4. Titration of His37 tetrad and thermodynamic linkage to channel opening.
A Deprotonated fraction vs. pH for each titration step: S0–1 (from 0 to +1 charge); S1–2 (from +1 to +2 charge); S2–3 (from +2 to +3 charge); S3–4 (from +3 to +4 charge). The curves are the best fits to the Hill equation. The obtained pKa values are indicated on the right. Experimental data are taken from Cross with respective error bars of 0.2, 0.2, 0.3 and N/A 14, and Hong with respective error bars of 0.1, 0.1, 0.3 and 0.6 15. B. Thermodynamic linkage between stepwise titration and channel opening. Horizontal lines indicate protonation steps, while and vertical lines represent conformational change from the closed (blue) to open (red) state. Calculated pKa’s for protonation steps and calculated free energies (in kcal/mol) for conformational transitions are indicated.

