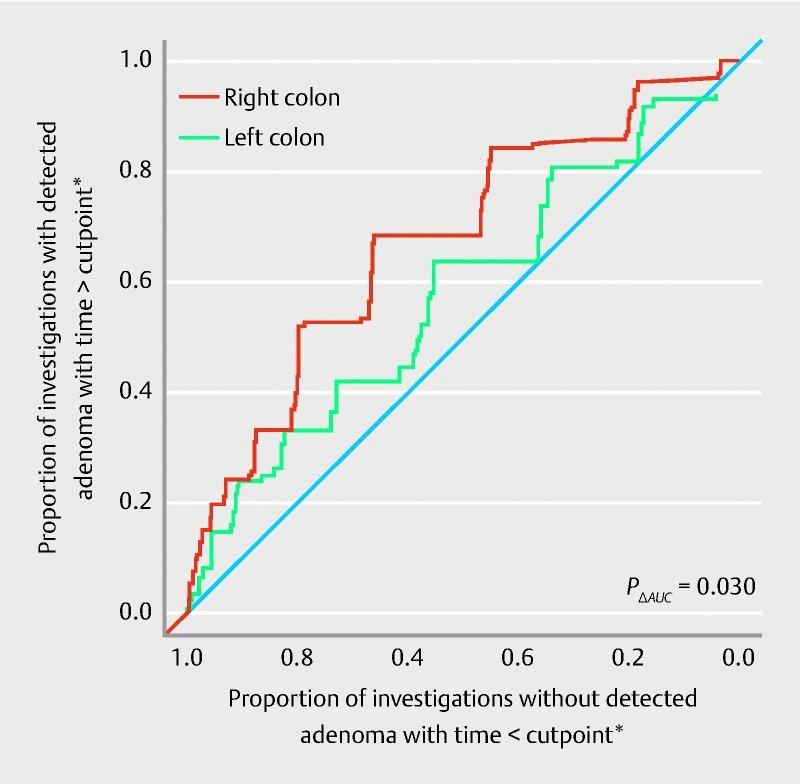
Fig. 3.

Receiver-operating characteristic (ROC) curve for the performance of adenoma detection according to observation time in the proximal and distal colon. For the proximal colon the area under the ROC curve was 0.68 (95 % CI 0.62 – 0.73). For the distal colon the area under ROC curve was 0.58 (95 % CI 0.51 – 0.65). *As in common ROC analysis all possible cutpoints for investigation time derived from the data were considered and combinations of resulting proportions are illustrated in the figure.
