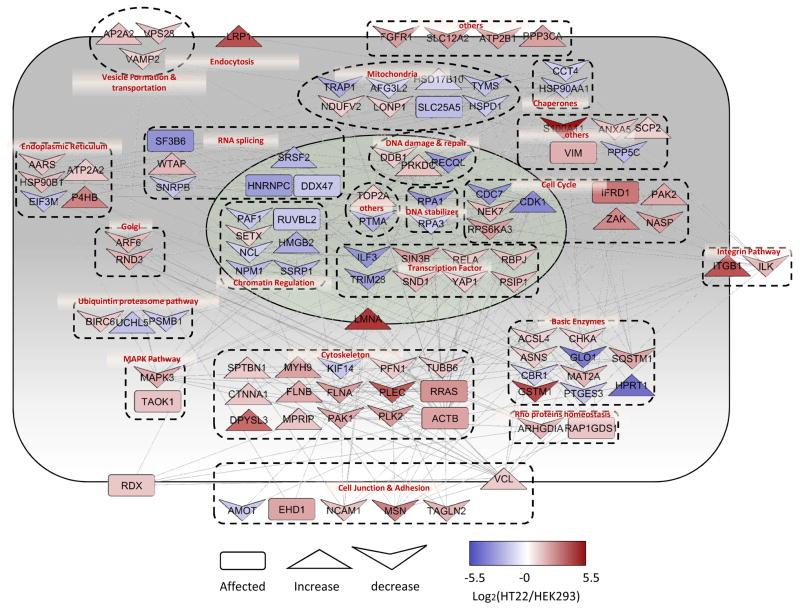
Figure 3.
HILAQ analysis of oxytosis cell model. Interaction network analysis on 108 cell death enriched proteins with 2 fold change after 1 h labeling in HEK293T and HT22 cells. The protein network and localization were analyzed by String and visualized by Cytoscape. The log ratio used in visualization was the average ratio of replicates. The red color represents proteins up-regulated in HT22 while the blue color indicates down-regulation. Different shapes used in the figure represents the effects of the protein on cell apoptosis according to previous reports.

