
Figure 6. Environmental temperature correlates with circulating monocyte levels in humans.
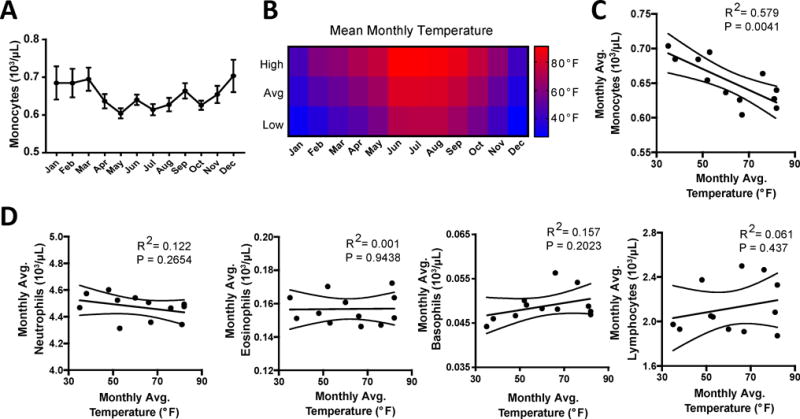
A) Peripheral blood was assayed for complete blood counts (CBC) with automated differentials for monocyte levels through a 12-month period and plotted as monthly averages. B) Monthly environmental temperature with mean high, average, and low temperatures reported for each month that peripheral blood was collected. C) Regression plot of average monthly cell numbers against average monthly temperature for monocytes. E) Regression plots for Neutrophils, Eosinophils, Basophils, and Lymphocytes numbers against average monthly temperature. Data in A and C are mean ± SEM, and represent a total cohort of n=15,516 patients, with approximately 1,200 measurements per month. Pearson linear regression analysis was performed to test correlations between monthly cell counts and environmental temperatures, p-values and R2 are reported.